GVSOC
The Full System Simulator for profiling GAP Applications
GVSOC is functionally equivalent to the real chip. The compiled code that can run on the chip will also run as it is on the simulator.
To properly profile applications, it contains timing models to properly report performance within an error rate of below 20%.
We are also currently adding power models to report power consumption, also within an error rate below 20%.
The speed of the simulator is not sacrificed. Thanks to a good trade-off between accuracy and speed, it can still simulate at around 20 million instructions per second, about 10 times less speed than the actual chip.
Power features, frequency domains and power islands are modelled too and impact the timing and power consumption measurements.
Debug traces can also be activated to help in debugging applications. For example, DMA activity or core instruction traces can be generated.
To allow full applications to be simulated, a set of common devices that you can plug to our boards like cameras, microphones and flash are also simulated.
Now let’s see how to use it.

To use GVSOC with the GAP SDK, just build the SDK as usual and configure it for the board you want to use. Be careful to select the proper board configuration, for example here configs/gapuino.sh as this will tell GVSOC which devices to simulate.
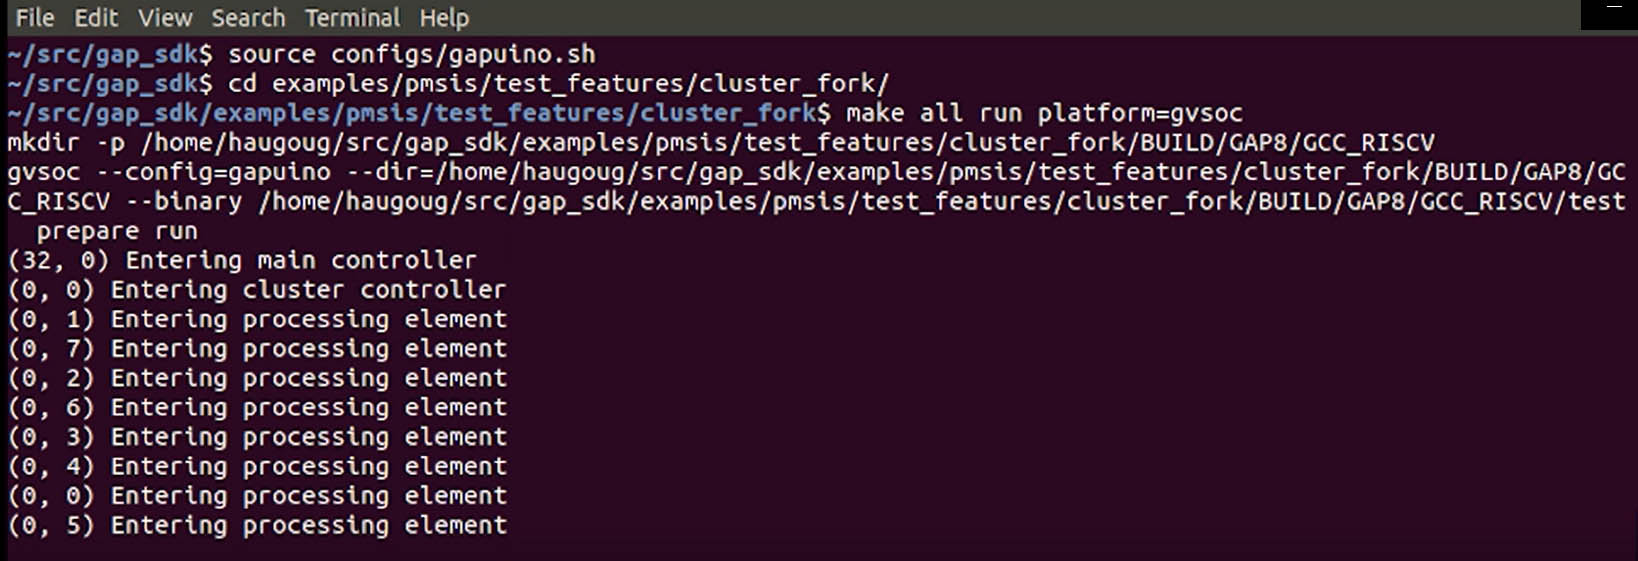
Now let’s try this simple example [ highlight examples/pmsis/test_features/cluster_fork] which is offloading a simple entry to cluster side and forking the execution on the processing elements.
Just go to the example directory and execute make with these options [highlight make all run platform=gvsoc]. As you can see, each core is dumping a message when it starts.
Now let’s see what happen on the chip by activating VCD traces with this option [highlight “runner_args=–vcd”]. This option tells GVSOC to use gtkwave to view execution traces.
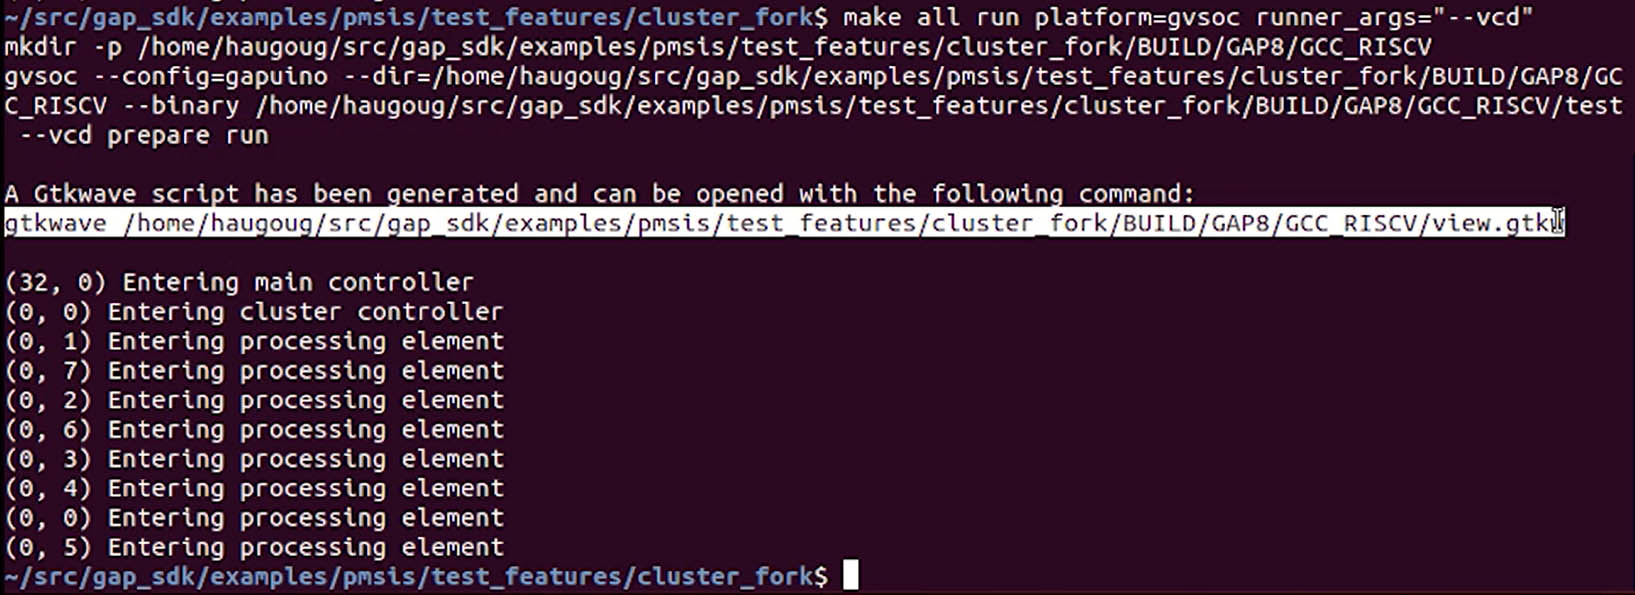

Now we start gtkwave with the trace. Click the following button to bring our trace to the window. This view shows a timeline of the activity of the system.
You can see first some activity on the fabric-controller as the main function is executed there. Then you see near the end, the offload to the cluster triggering some activity. Let’s zoom there to see what is happening.
Now you see the cluster entry point being executed on the first core, which is then forking the execution on all cores. As you can see, this view is useful to understanding what is going-on in the chip.
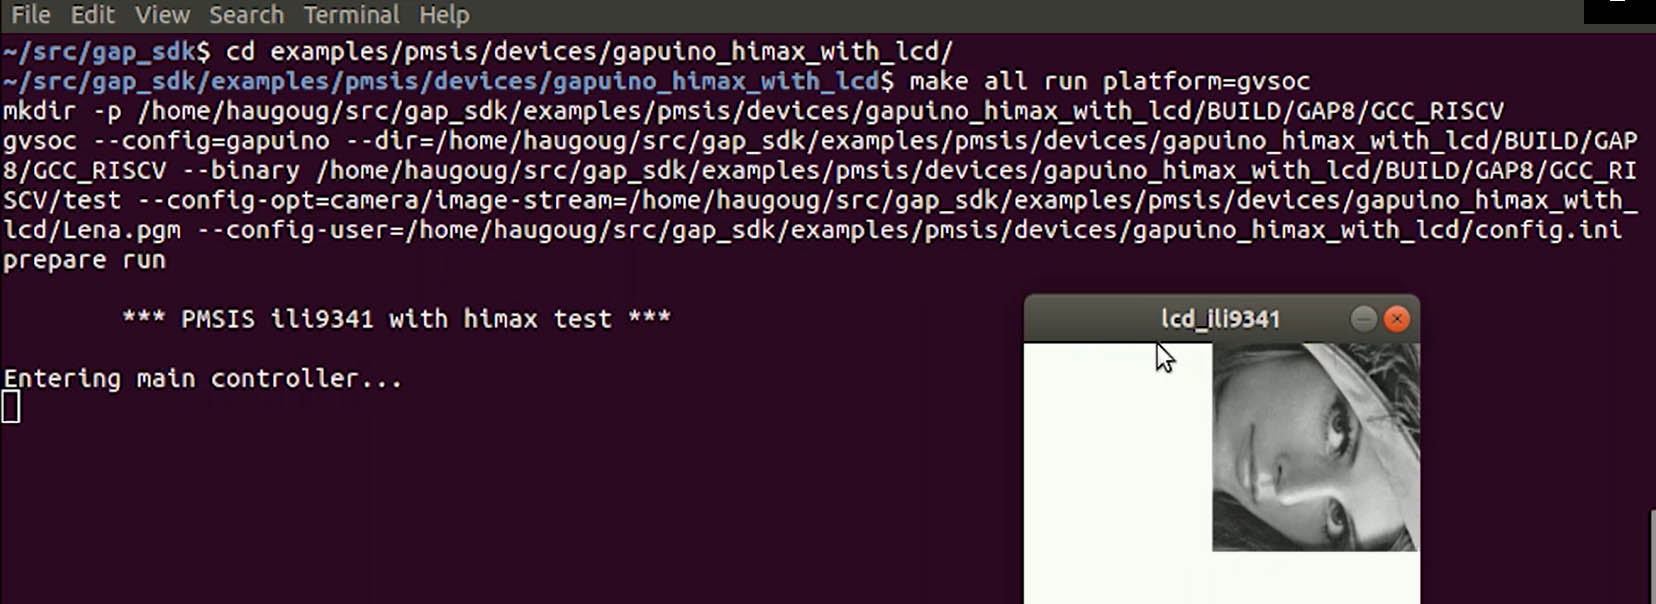
Now let’s see how GVSOC simulates a full system. Change to the highlighted directory [highlight examples/pmsis/devices/gapuino_himax_with_lcd] and execute the example using GVSOC as before [highlight command].
This example is capturing images from the camera and displaying them on the display device. To simulate a full system, GVSOC camera model has been fed with an image file and is streaming it to the chip.
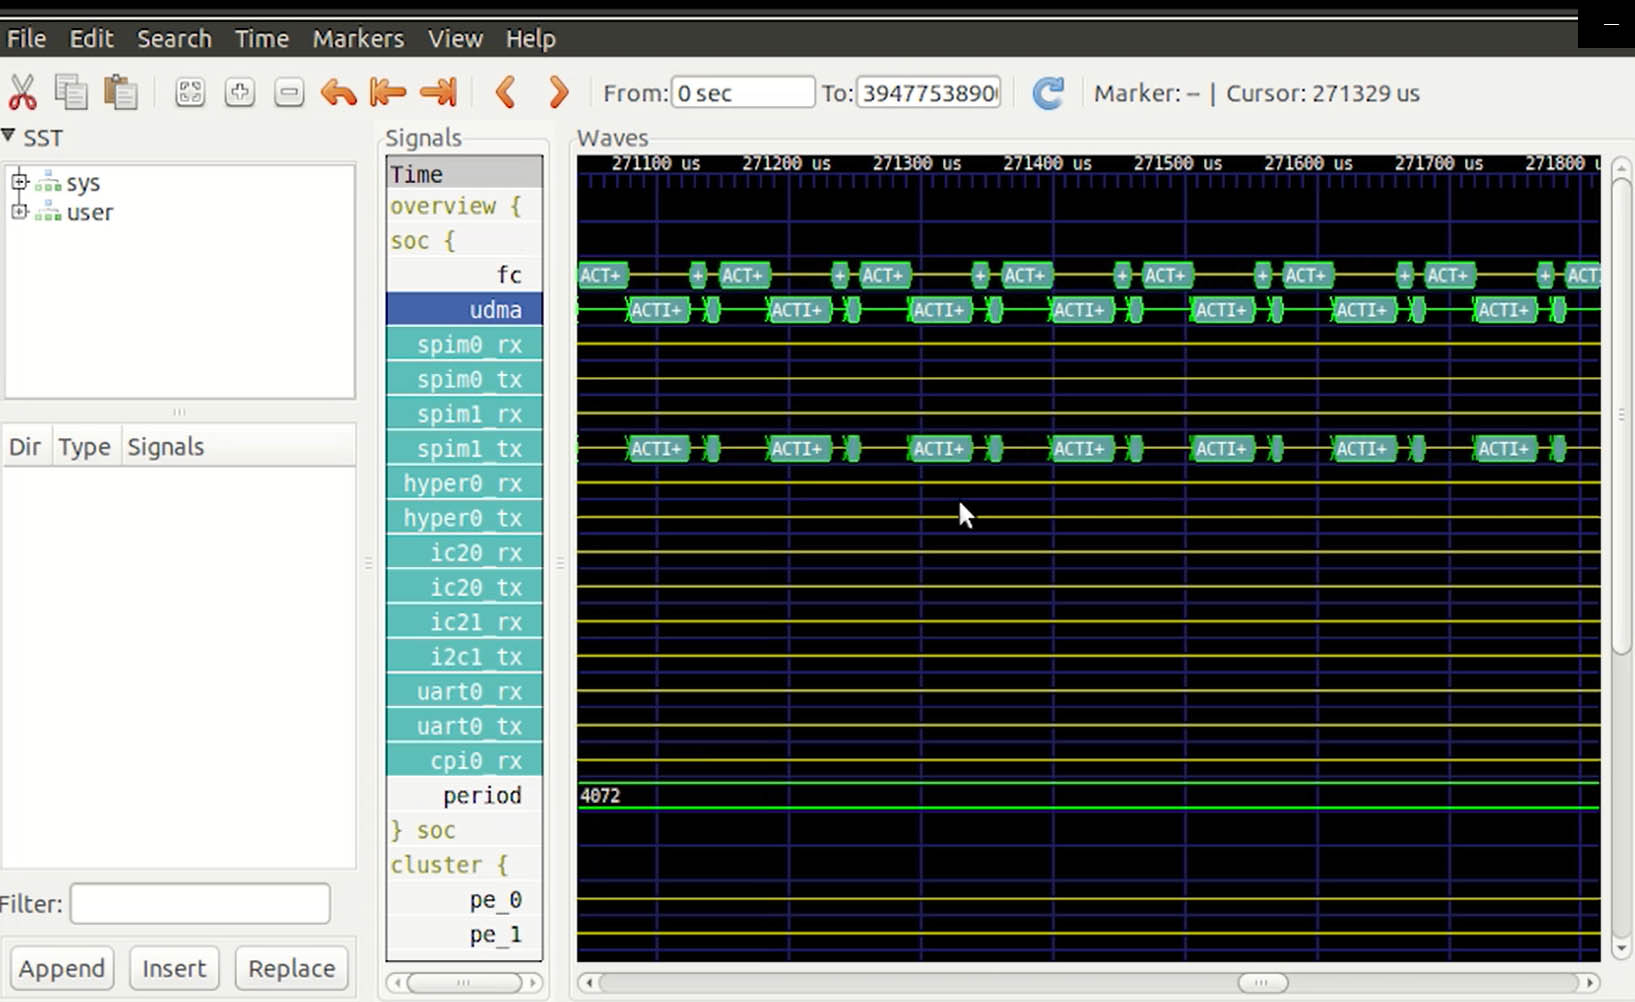
Let’s see with the profiler what is going-on with the vcd traces. The execution is much slower, but we’ll get much more detailed information.
The activity is now split between the fabric controller and the micro DMA. If we zoom-in a bit and open the micro DMA group, we can see the transfers on the CPI interface when the image is streamed into the chip and the ones on the SPI interface when it is streamed to the display.
In GVSOC, the timing of these transfers is simulated accurately so that this timeline can be used to identify bottlenecks on the chip interfaces.
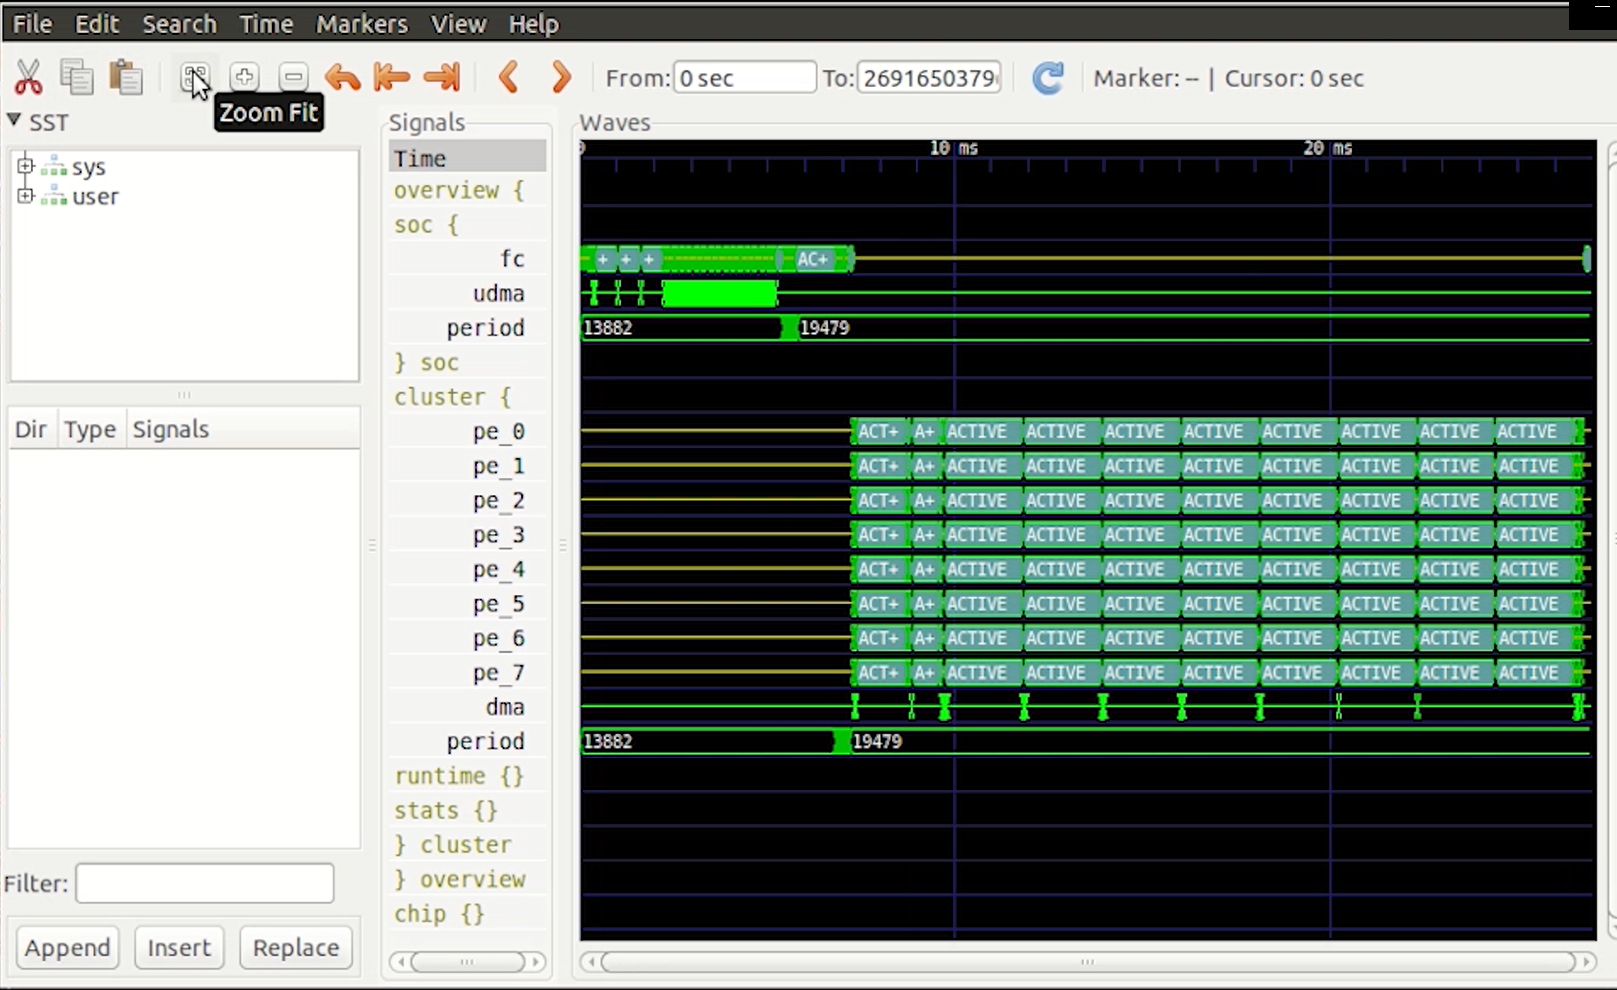
Now we are going to look at a more complex example. Let’s go to the MNIST example folder [highlight examples/autotiler/Mnist] and run the example with the vcd option. Now open the profiler and zoom out. Now you quickly see the activity on the cluster cores. This corresponds to the computation of the MNIST CNN layers. As you can quickly see with this tool, the mapping of MNIST is quite efficient as we don’t see a lot of holes in the execution.
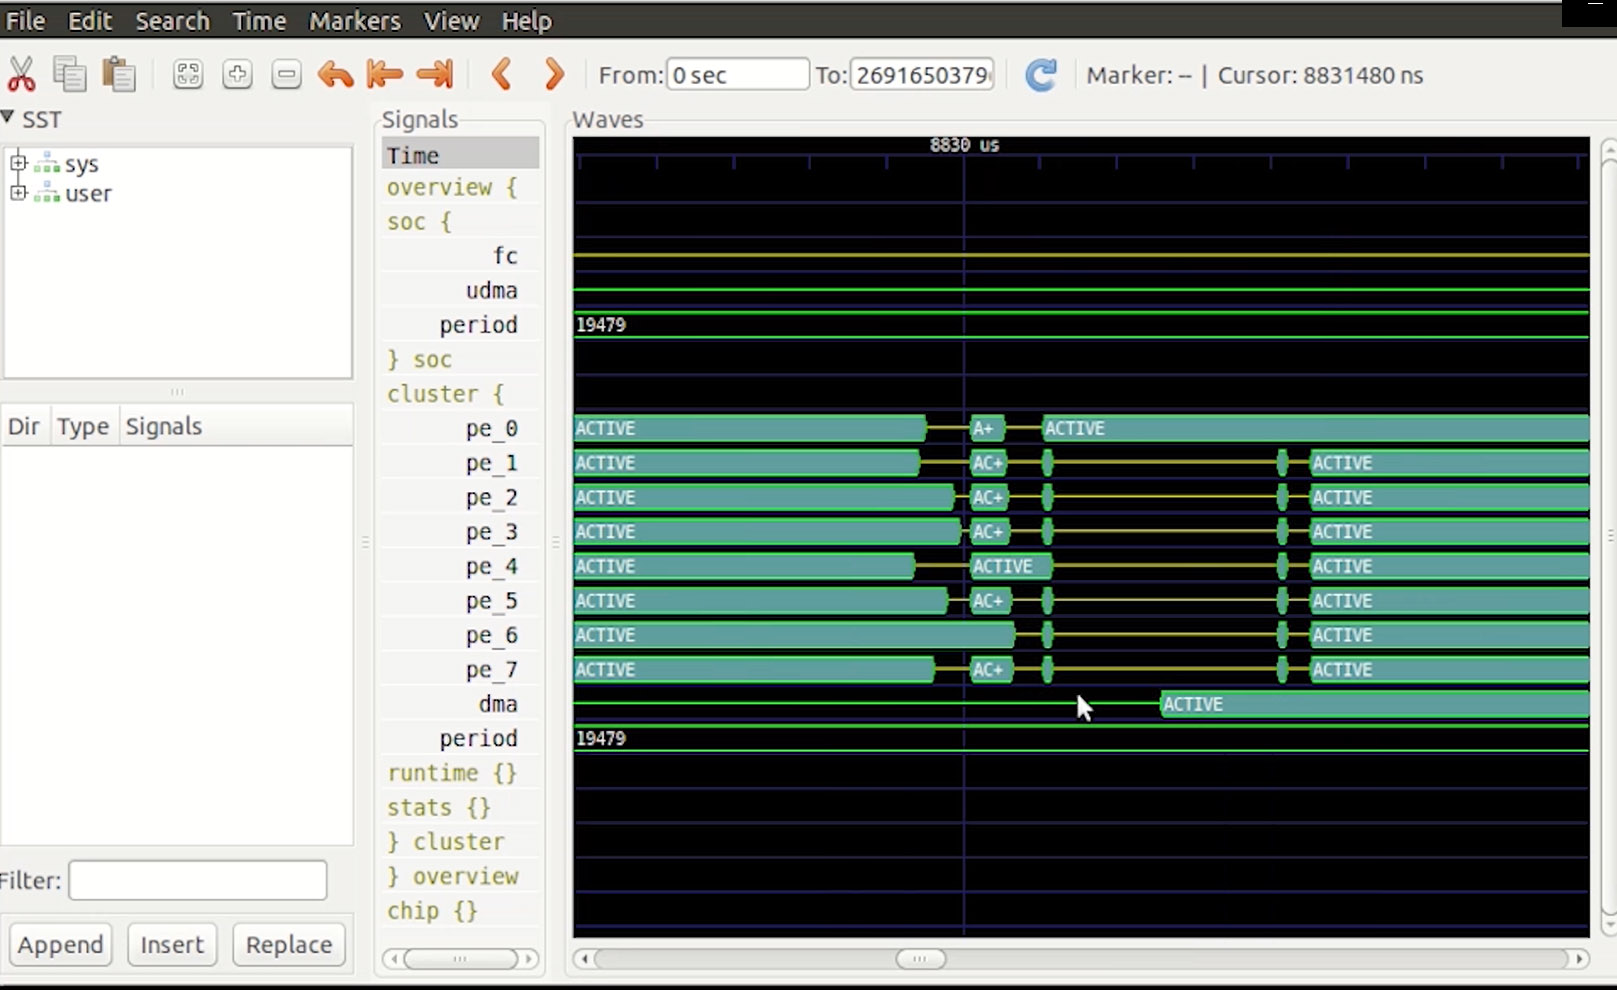
We zoom in a bit on a portion where we see a hole, we can better understand how the layers get executed. You can see at a certain point all cores stopping except core 0, which is the master, and is preparing the next layer by first pushing new DMA transfers and then doing a fork to parallelize the layer.
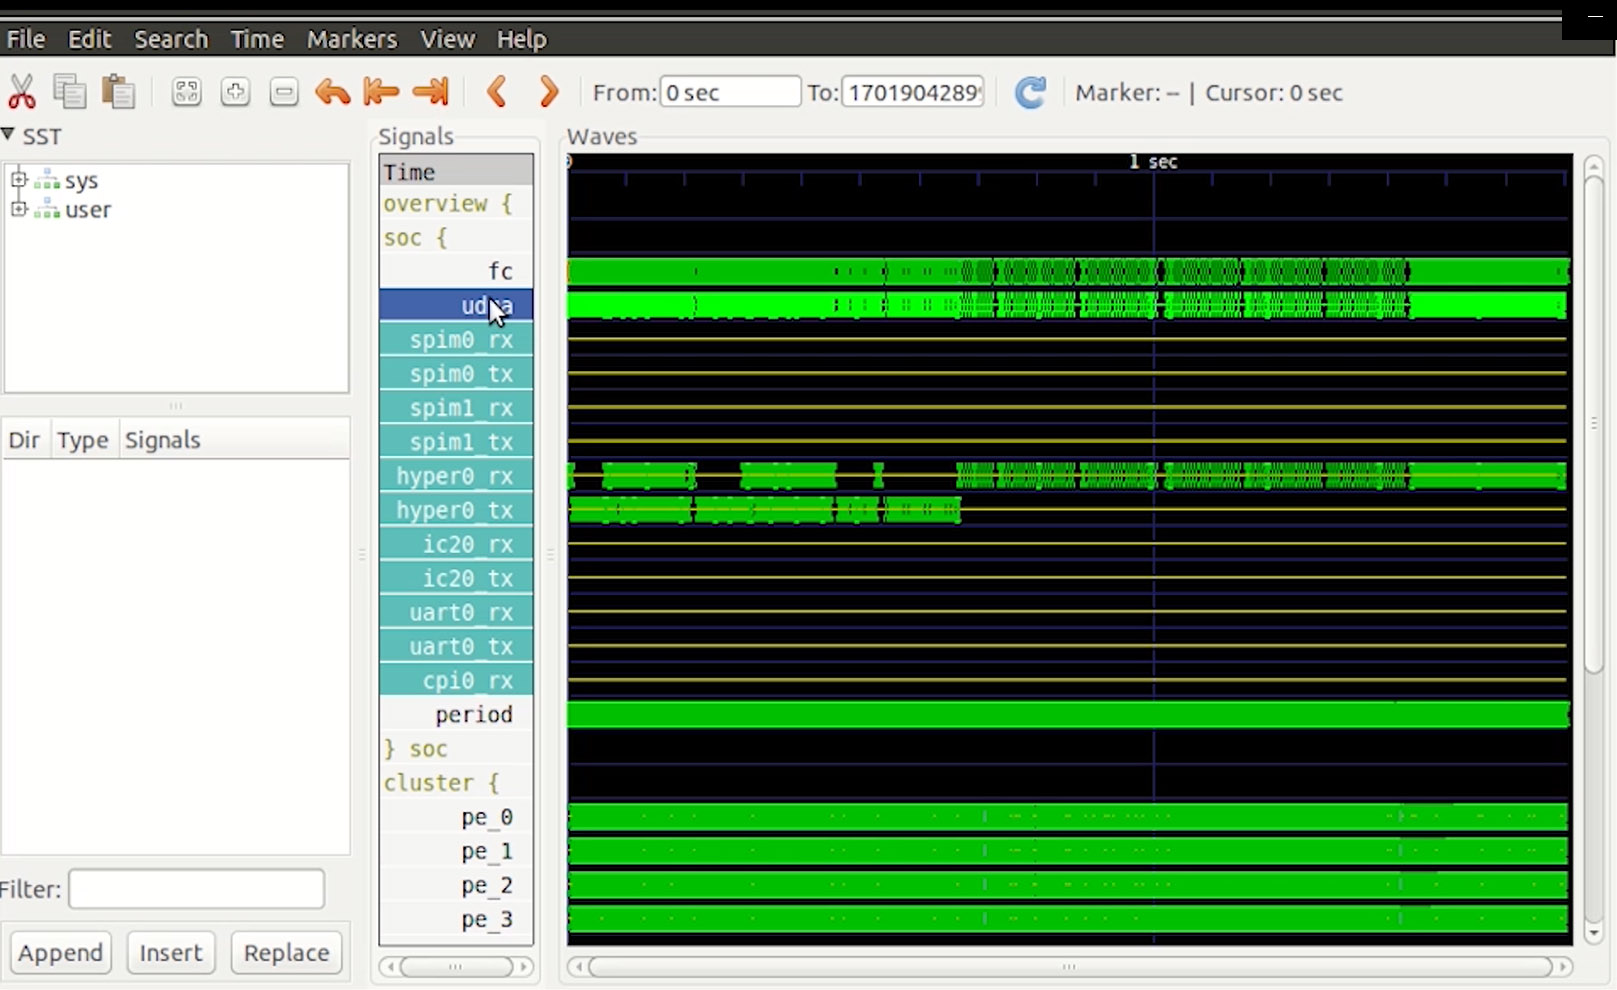
Now we’ll look into the execution of a very complex network, MobileNet, which is stressing the architecture much more. As you can see, this is very dense, as we are looking at 85 million cycles. We first see that there is a lot of activities on the micro DMA. Let’s click on it to see what it is. This corresponds to some transfers on the HyperBus interface, firstly because this application is using a lot of weights stored in the external HyperFlash and also a lot of intermediate results which cannot fit in the chip which are stored temporarily in the external RAM.
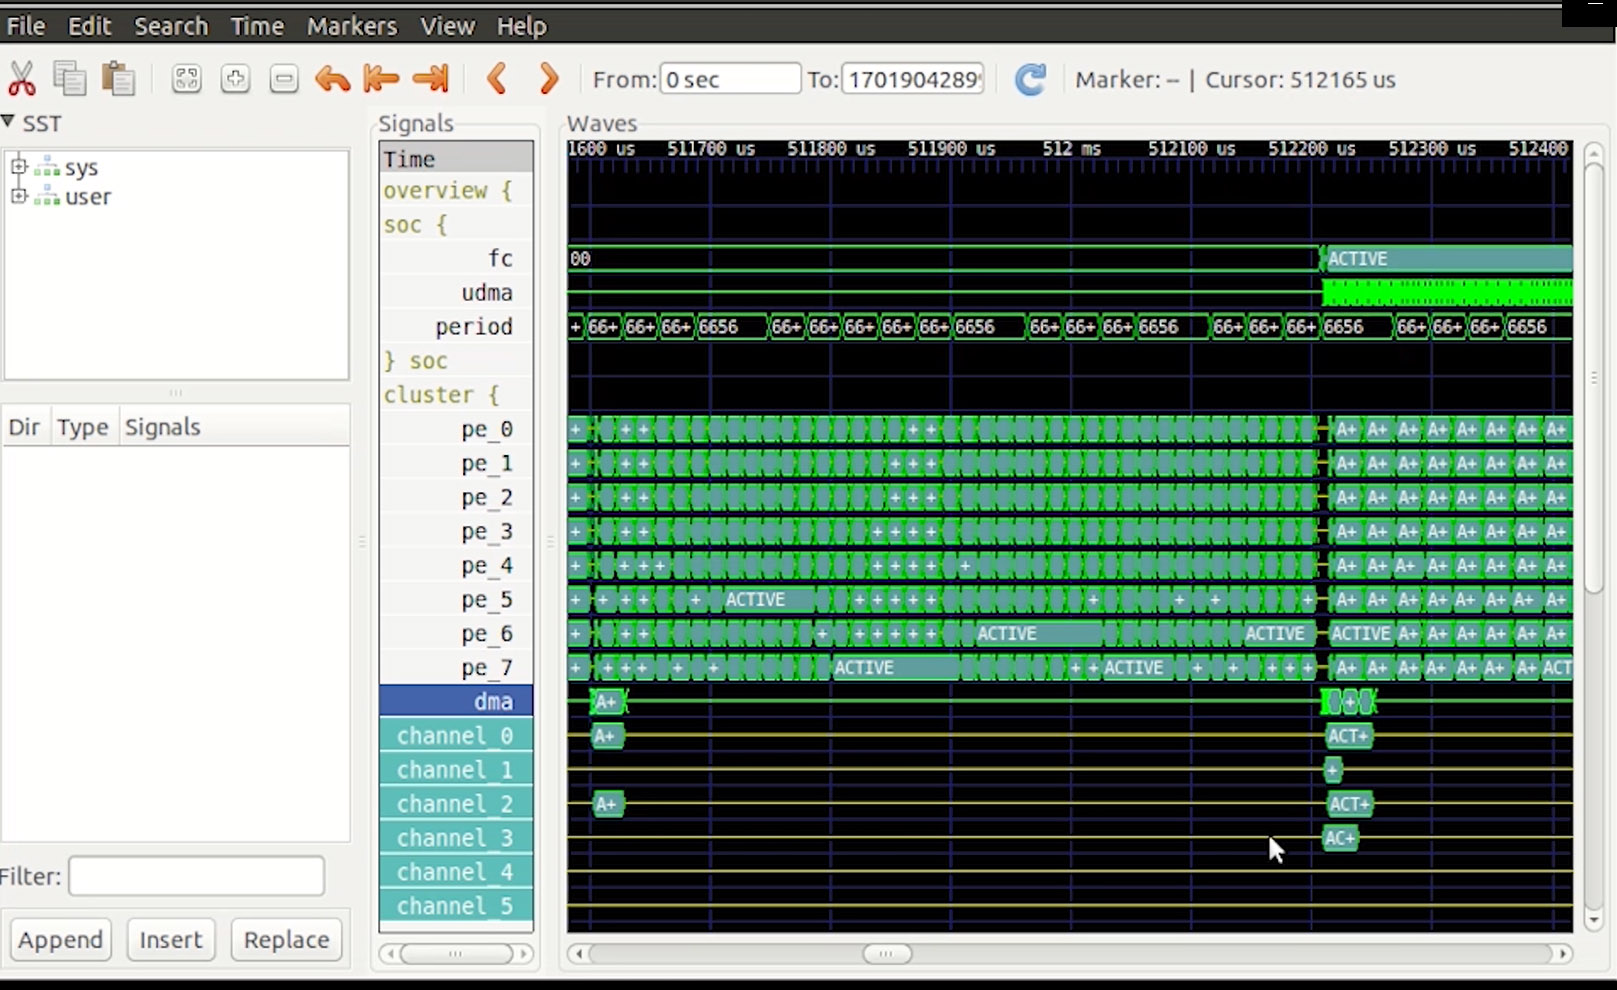
We also see lots activity in the cluster DMA as both the micro DMA and the cluster DMA are used to exchange the data between the HyperBus interface and the cluster memory. Let’s zoom in a bit.
As you can see, although there is a lot of traffic going on, the cores are kept busy most of the time, thanks to the GAP AutoTiler which is properly balancing DMA transfers and computation so that operands for operations are ready when needed.
To aid in debugging applications, GVSOC provides system traces for monitoring what is happening in the architecture.
For example, you can activate instruction traces to see what each core is executing. Let’s go to the MNIST example and try it with option –trace=insn.
Firstly, you can see the activity on the fabric controller. Each line represents one instruction with information about what is being accessed like registers and memories, which is very convenient for debugging memory corruption. If we go further in the trace we then see the parallel execution on the cluster, which is also useful for debugging performance issues.

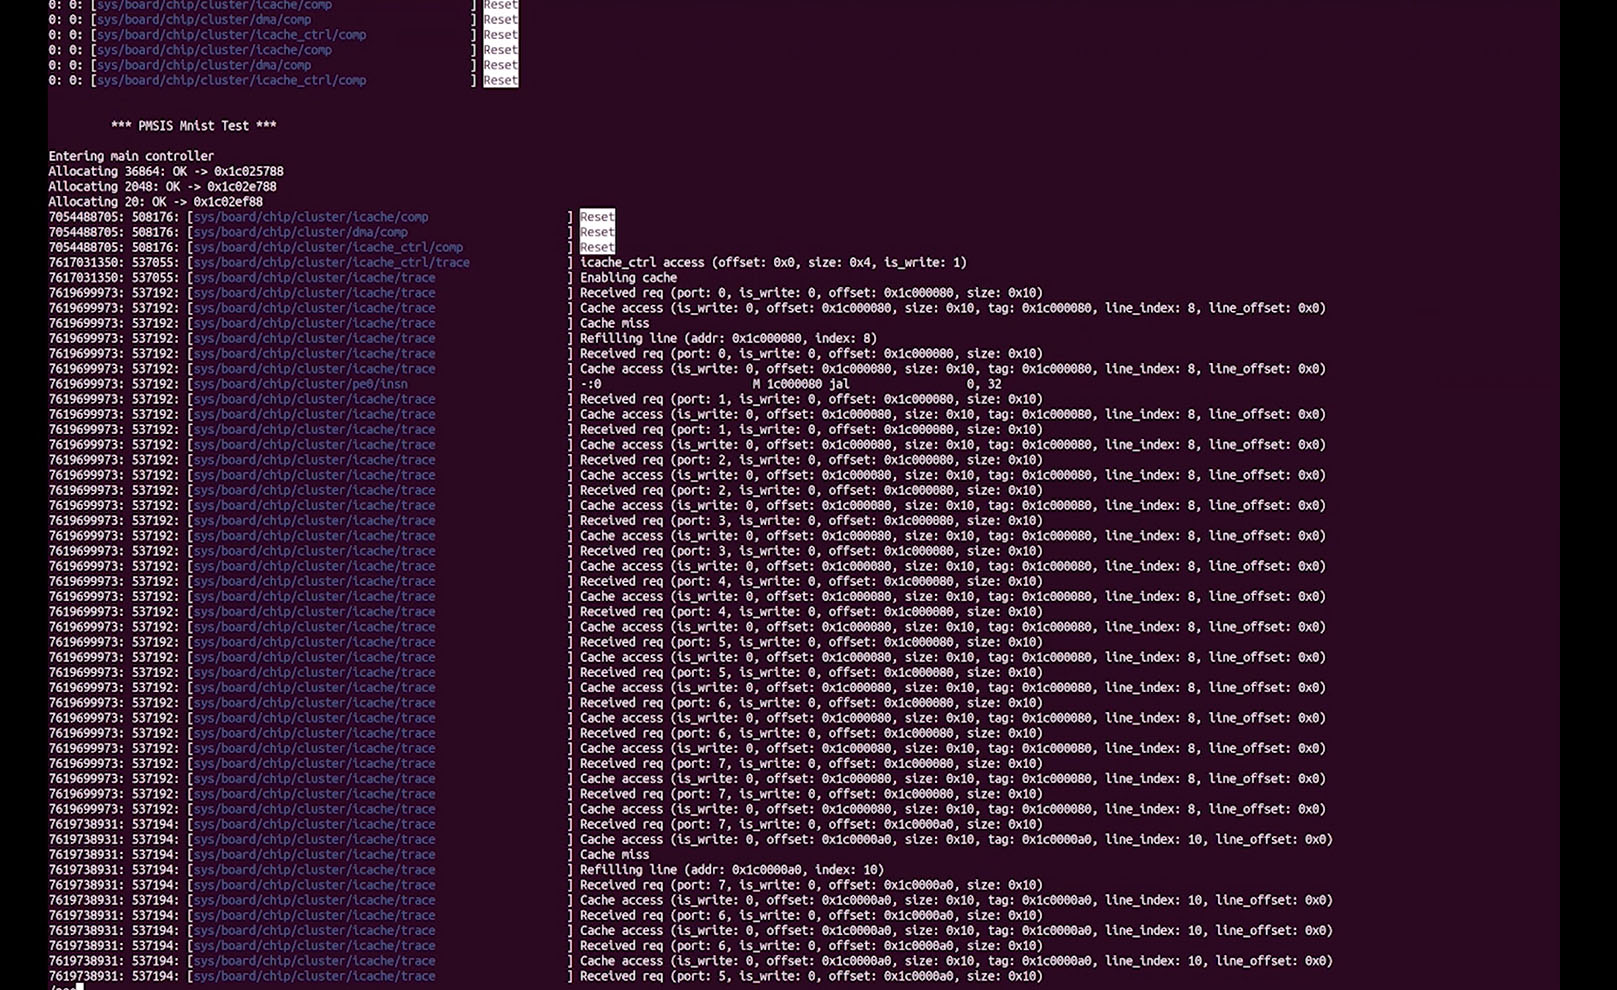
We can also activate more traces through the option –trace which is a regular expression matching the path of the trace in the architecture and can be used several times. For examples, let’s see pe0 instructions, dma transfers and cache misses with the following options [highlight –trace=pe0/insn –trace=dma –trace=cluster/icache]. Now we get very detailed information about what is going on, which can be useful for tracking down complex bugs.


